Perkin Elmer Spectrum 400 IR/NIR#
Fourier-transform infrared spectroscopy (FTIR) is a technique used to obtain an infrared spectrum of absorption or emission of a solid, liquid or gas. An FTIR spectrometer simultaneously collects high-resolution spectral data over a wide spectral range. This confers a significant advantage over a dispersive spectrometer, which measures intensity over a narrow range of wavelengths at a time.
The term Fourier-transform infrared spectroscopy originates from the fact that a Fourier transform (a mathematical process) is required to convert the raw data into the actual spectrum.
Procedure#
Before you start making solutions in the Pchem lab, ensure that the Perkin Elmer Spectrum 400 FT-IR/FT-NIR Spectrometer is turned on (it should not be turned off)
Log into the Spectrum IR software on the computer

The first set of samples are analyzed using the movable salt plates (in a desiccator to the left of the instrument)
Salt Plate Analysis#
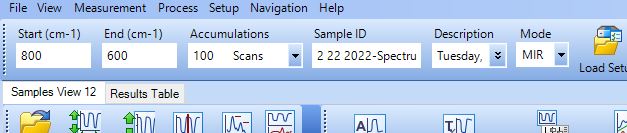
In the Tabs on the bottom of the screen, you will be able to adjust several factors for your experiment such as: sample name, save location, instrument beam path, advanced settings, and basic instrument set-up
In this experiment, you will mainly be focusing on just sample name, save location, and basic instrument set-up to adjust a few parameters
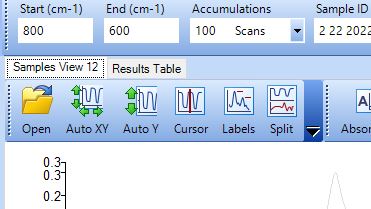
It is also noted to adjust the parameters at the top of the page as well so that they reflect what you have included in the bottom (specifically Sample ID)
Sample Naming#
You can enter a name for your sample in both the Auto-name and Auto-description box after the [nnn] listed
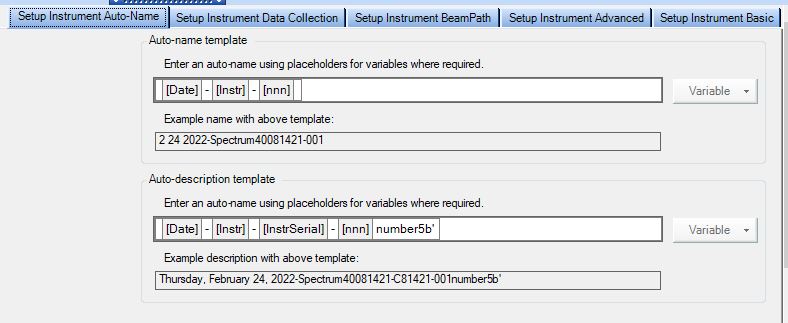
Sometimes the auto-naming function does not work as you would like, so you may manually enter a name for the file up at the top of the page where it says ‘Sample ID’.
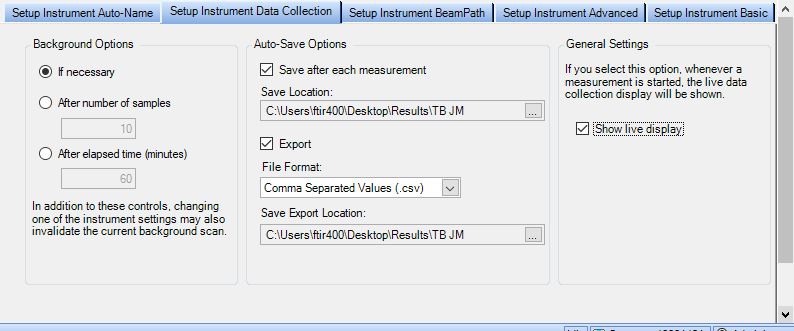
Data Collection#
Under Auto-Save Options you can chose where your files will save and the file format to export as
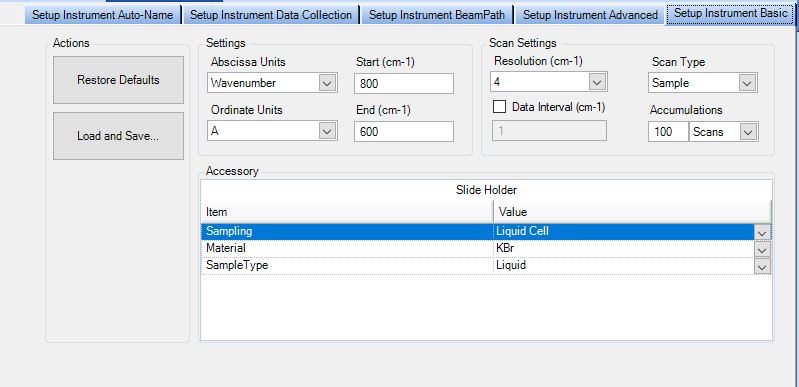
Basic Instrument Settings#
Here you can chose the wavelength range you wish to measure your samples within, the resolution, scan type, accumulations (how many scans), and units (absorbance, etc.)
Scanning Your Samples#
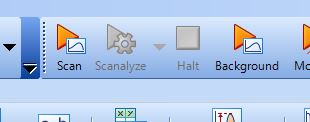
Before scanning any of your samples, you must collect a background spectrum beforehand
The sample compartment should contain the salt plate with your solvent.
Click Scan
Starting with the lowest concentration sample, place several drops (2 or 3) of your sample onto the salt plate using a Pasteur pipet
Load the salt plate into the sample holder. Be sure to only touch the outer edges of the salt plates to insert it into the holder.
You may notice that the “Scan” button you used has changed to a slightly different icon after running the background (it will still say Scan)
Click Scan and notice that a green progress bar appears at the bottom of the Viewing Pane
When the scan is complete, you will see your spectrum appear in the Viewing Pane
You can see a list of all of the scans you run below the Viewing Pane, as well as under the Results tab listed near the top
After each scan, remove the salt plates carefully, and clean with methylene chloride between uses. This done by adding 2 drops to each salt plate and letting the plates air dry.
Caution
The salt plates are very fragile, so when you go to clean them make sure to have a kim wipe down on the benchtop to set them on.
Load your next sample onto the plates and insert them into the compartment within the instrument
Continue this process for the rest of your samples by repeating the above steps
Data Analysis#
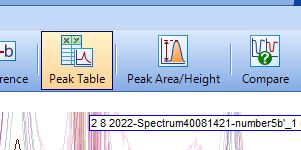
Determine the peak height (essentially the maximum absorbance) of the spectrum for each visible peak int he regions of interest
You can do so by either exporting your data and estimating, or you can utilize the Peak Height function within the software
Fixed Pathlength Cell Analysis#
Similarly, you will run your samples again using a fixed pathlength cell to determine which method is better at analyzing your samples
Using a plastic syringe, you will inject your sample into the cell (it may overflow slightly)
Following the sample procedure above, you will run each of your samples, flushing the fixed cell with methylene chloride in between runs.
Tip
Starting with the least concentrated sample and working up to the most concentrated sample will greatly increase the accuracy of the data for fixed salt plates.
Once all of your scans has finished you can analyze your data similar to the steps provided above when using the salt plates.