The pKa of an Indicator UV Absorption Spectrophotometry#
The use of spectrophotometry for the evaluation of the pKa of an acid-base indicator is demonstrated in this experiment.
Theory#
This lab is written to present a challenge to the chemist. The theory and the experimental set-up are all aimed at bromothymol blue (3′,3″-dibromothymolsulfone-phthalein), a member of a large class of acid-base indicators known as “sulfone-phthaleins”. However, you will be assigned a different indicator in probably a different class and will need to consider how to adapt the experiment for that different dye! Be sure to start early so you don’t finish late! It is also imperative to keep in mind the goals of the experiment as well as data reduction.
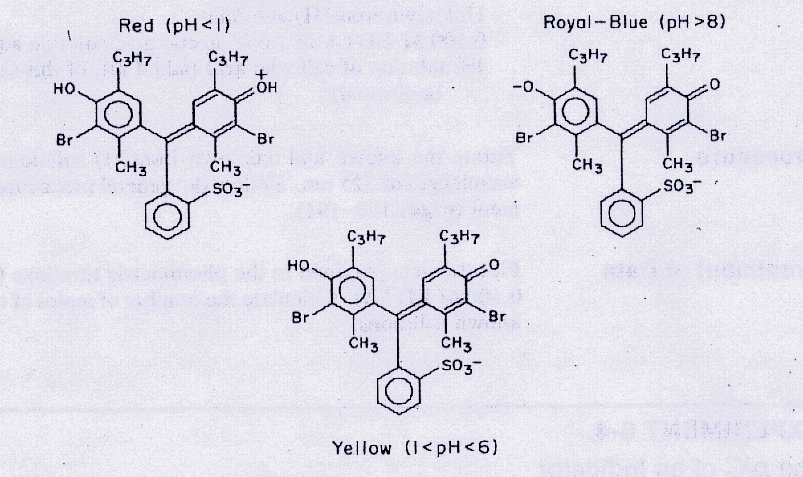
Bromothymol blue has three possible forms depending on pH, as showin in Fig. 15. The equilibrium between the yellow acid form (HIn-) and the royal-blue basic form (In2-) can be represented as
and the equilibrium constant for the acid dissociation is
where \(\mathcal{A}\) refers to the activity.

Fig. 15 Structure of bromothymol blue at different pH.#
Converting to logarithmic form and rearranging terms yields
Since activity is directly related to concentration by activity coefficient γi, this expression can be expressed as
The ratio of activity coefficients may be incorporated into the equilibrium constant to give
where pKa′ is an apparent indicator constant. Thus a plot of pH vs \(\log \left( \frac{\text{In²⁻}}{\text{HIn⁻}} \right)\) should give a straight line with an intercept (at which [In2-] = [HIn-]) equal to pKa′.
In this experiment, the indicator bromothymol blue is dissolved in a series of buffer solutions of known pH. The ratio \(\frac{\text{In²⁻}}{\text{HIn⁻}}\) is then measured spectrophotometrically and pKa′ is calculated from a plot of (23).
Experimental#
Apparatus#
Spectrophotometer (Perkin-Elmer Lambda 1050 UV/Vis/NIR)
Cuvettes (2)
Pipets, 1 mL, 5 mL, and 10 mL
Beaker (3), 100 mL
Volumetric flasks (4), 25 mL
Chemicals#
indicator such as bromothymol blue, 0.1% in ethanol
0.10 M sodium hydrogen phosphate
0.10 M potassium dihydrogen phosphate
Hydrochloric acid (conc)
4 M sodium hydroxide
Procedures#
Note
Bromothymol blue is unstable in acid media over prolonged periods of time. Therefore, obtain all absorbance measurements with a solution on the same afternoon that you prepare the solution.
A. Absorption Spectra of Bromothymol Blue at Various pH Values#
- pH ≈ 1
Carefully pipet 1 mL of bromothymol blue stock solution into a clean 25-mL volumetric flask. Add a few milliliters of distilled water, then 4 drops of concentrated HCl, and finally dilute to the mark with distilled water. Transfer some to a cuvette and obtain an absorption spectrum between 350 and 600 nm.
- pH ≈ 6.9
Pipet 1 mL of indicator in a 25-mL volumetric flask and add 5 mL each of 0.10 M Na2HPO4 and KH2PO4 from a pipet. Dilute to the mark and obtain the spectrum.
- pH ≈ 13
To 1 mL of indicator in a 25-mL volumetric flask, add 12 drops of 4 M NaOH. Dilute to the mark and obtain the spectrum.
The three curves, when plotted on a single axis should intersect each other at a single point, called an isosbestic point.
B. Absorbance of Solutions (Differing in pH) at Selected Wavelengths#
Refer to the graph you have made and select two wavelengths at which further absorbance measurements will be made. You should select a wavelength to the left of the isosbestic point and one to the right of this point. Choose wavelengths where the acid and base forms of the indicator show a maximum difference in their absorbance.
Measurements will be made on solutions with seven different pH values other than the three solutions studied thus far.
Sample |
mL indicator |
mL H2PO4- |
mL HPO42- |
pH |
|---|---|---|---|---|
1 |
1.0 |
5.0 |
0.0 |
~4.5 |
2 |
1.0 |
5.0 |
1.0 |
6.2 |
3 |
1.0 |
10.0 |
5.0 |
? |
4 |
1.0 |
5.0 |
10.0 |
? |
5 |
1.0 |
1.0 |
5.0 |
? |
6 |
1.0 |
1.0 |
10.0 |
? |
7 |
1.0 |
0.0 |
5.0 |
~9.1 |
Pipet the above quantities for a given pH into a 25-mL volumetric flask and dilute to the mark. Measure the absorbance of each solution at the two selected wavelengths. Remember to readjust the instrument to 0 and 100%T whenever you change the wavelength setting. Alternatively, it can be very effective to scan each sample and extract the absorbance information from the plot. Calculate the pH of the above solutions given the fact that the second ionization constant for phosphoric acid is 1.3 × 10⁻⁷ (pK₂ = 6.89). Alternatively, pH values can be measured by a pH meter.
Treatment of Data#
Caution
This is written for the experiment enclosed. Since you used a different indicator, your pH values will be different and you will need to THINK about the data reduction!
Combining the absorbance values at the two selected wavelengths (obtained in Procedure A) with the data obtained in Procedure B, plot absorbance vs. pH for each of the two wavelengths studied. The midpoint of each curve corresponds to equal concentrations of the acid and of the base forms of the indicator. From each graph, determine the pKa′ of the indicator.
Draw two horizontal lines across each of your A vs. pH plots; one corresponding to the absorbance of the acid form of the indicator and the other corresponding to base form of the indicator. Any deviation of the actual absorbance from these two lines is a measure of the extent to which one form or the other has been converted to the other form.
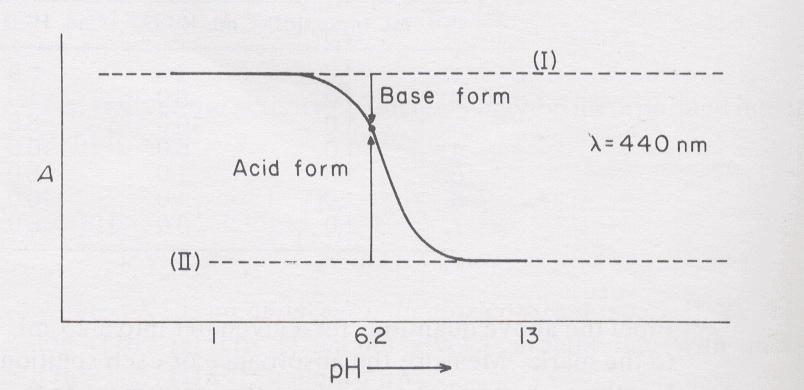
Consider the absorbance reading obtained for the pH 6.2 solution (Fig. 16). By subtracting the absorbance at 6.2 from the absorbance at pH 1, a measure of the amount of In2- in the solution at pH 6.2 can be obtained. By subtracting the absorbance at pH 13 from the absorbance at pH 6.2 a comparable measure of the amount of HIn- in the pH 6.2 solution can be obtained. The ratio of In2- to HIn- can then be found. The ratio also can be found by measuring with a ruler the relative lengths of the two arrows indicated in Fig. 16.

Fig. 16 Aborption of an acid-base indicator as a function of pH.#
Determine the In2-/HIn- ratio that corresponds to each of the points plotted on one of your two absorbance vs. pH graphs, and plot \(\log \left( \frac{\text{In²⁻}}{\text{HIn⁻}}\right)\) vs. pH. That point where the line crosses the vertical axis at zero concentration corresponds to equal concentrations of the acid and base forms thus we can obtain the pKa′. Report all three values for pKa′.
Discussion must include comparisons to literature values for the pKa as well as consideration of the color change range. You should also consider how you performed the experiment and include changes you would make in the procedure based on your experience.
Questions#
What is meant by an isosbestic point?
If the molar absorptivities of HIn- and of In2- were determined at a wavelength corresponding to an isosbestic point, how would they compare in value?
What factors could contribute to the inability of an operator to obtain an isosbestic point in a study of this nature?
Could this experiment be applied to an indicator for which no isosbestic point was obtained in the available spectral range? Explain briefly.
If you were given a series of your indicator solutions of varying pH and were asked to determine the total amount of indicator present in each solution, how would you choose wavelengths and how would you perform the analysis? (ps, a pH meter is not available)
Suppose the indicator under study were a dibasic acid which dissociated according to the general equation:
\[\text{H₂In} + 2 \text{H₂O} \leftrightharpoons 2 \text{H₃O⁺} + \text{In²⁻}\]with both hydrogens coming off simultaneously in a single step (a rare case).
If \(\log \left( \frac{\text{In²⁻}}{\text{HIn⁻}}\right)\) were plotted against pH, what would the slope of the resulting line be?
When the line crosses the zero axis, does pH = pKa? (Show your reasoning).
If the indicator dissociated according to the general equation (not a rare case)
\[\text{(HIn)₂} + 2 \text{H₂O} \leftrightharpoons 2 \text{H₃O⁺} + 2 \text{In⁻}\]what would you plot in order to get a straight line, and what would the slope of the line be? (Show your reasoning).
Reference books list the range of bromothymol blue as an indicator from pH 6.0 to 7.8. Can you account for the difference between the true pKa and the “apparent” pKa′ deduced from this range?
Outline how would perform this experiment to find both pKa values for a diprotic indicator like m-Cresol Purple. Be sure to include both “procedures” as well as pH’s for procedure B.