Fluorescence Spectroscopy and A Characterization of Quinine#
Theory#
Fluorescence is an analytically important emission process in which atoms or molecules are excited by the absorption of a photon. After a very brief lifetime (a few nanoseconds), the excited species then relax to ground state giving up their excess energy as a photon of lower energy. Fluorescence is one of two possible relaxation pathways for most molecules [1], the other being a nonradiative heat loss. The efficiency of a fluorescent molecule (\(Q_f\)) depends on, in part, with the number of molecules that take each pathway. A very efficient fluorescer will have a fluorescence efficiency of 1, i.e. all emitted energy is in the form of light emission. A nonfluorescent molecule will have an efficiency of 0, i.e., all emitted energy is released as heat.
The fact that very few molecules actually fluoresce makes this a very specific technique of analysis for those compounds that do. To determine if a molecule is likely to fluoresce, one needs to look at its structure. Saturated molecules and molecules with only a single double bond do not exhibit fluorescence. Molecules with at least one aromatic ring or multiple conjugated double bonds are likely to fluoresce in the visible or near ultraviolet regions. Molecular rigidity is a must. Phenaphthalein (Fig. 10A) has 3 aromatic rings yet is very loose and does not fluoresce (\(Q_f = 0\)), losing its energy via vibration and subsequent heat loss. Fluorescein (Fig. 10B) is a very similar structure with a bridging oxygen between two of the rings. It fluoresces very very well (\(Q_f = 0.98\)). In addition, substituents which are electron donating groups such as —OH, —OCH3, and —NH2 enhance fluorescence, likewise, electron withdrawing groups such as carbonyls or —COOH inhibit fluorescence.
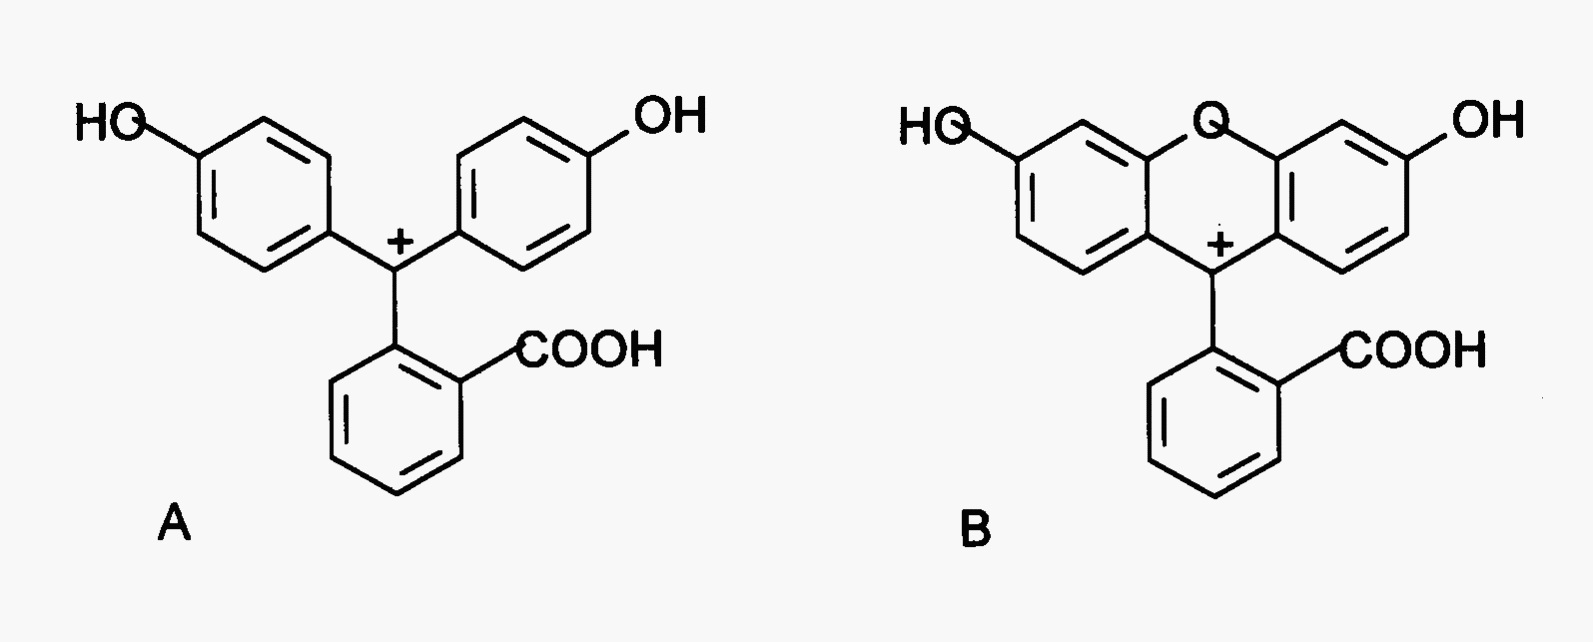
Fig. 10 Structures of (A) phenolphthalein (nonfluorescent) and (B) fluorescein (fluorescent). Note bridging oxygen makes fluorescein more rigid preserving excited state energy for photon emission.#
Temperature increases will cause more vibrational heat loss and subsequent loss of fluorescence as does a decrease in solvent viscosity. The presence of heavy atoms either in the solution or on the molecule promote phosphorescence, again at the cost of decreasing fluorescence. A fluorescent molecule with an acidic or basic substituent will also be subject to a pH dependence on fluorescence. Changes in the electronic character, especially on the number of possible resonance forms, will change the deactivation pathway. A species with a greater number of resonance forms will be more likely to fluoresce.
The term quenching is used describe any reduction in fluorescence intensity. Common types of quenching include concentration quenching, collisional quenching, and chemical quenching. In concentration quenching, the fluorescence-per-unit-concentration (aka sensitivity) decreases as concentration increases, as when \(A > 0.05\) per the discussion above. This is also referred to as the inner filter effect because the solution absorbs incident radiation such that it acts as a filter — no radiation reaches the emission zone. Collisional quenching may be caused by nonradiative energy loss from the excited molecules or the quenching agent (such as a heavy atom or even oxygen) may facilitate conversion of the excited singlet state molecules to a triplet state. Chemical quenching is due to actual changes in the chemical nature of the fluorescent substance. Aniline is an example: it fluoresces between pH 5 and 13 (where it has several resonance forms) but is non fluorescent as an anilinium cation below pH 5 nor as an anion above pH 13.
The amount of fluoresce for a molecule can be easily related to concentration using a calibration curve (of course if it didn’t, then there would be no reason for even looking at the technique!) The intensity of fluorescent radiation (\(I_f\)) is proportional to the absorbance of the molecule, the lamp intensity (\(I_0\)), the fluorescence efficiency of the molecule (\(Q_f\)) and instrumental parameters (\(k\)) as such:
Expansion of this expression leads to a nasty power function. Provided that absorbance, \(A = εbc\) is very small (\(< 0.05\)), most of the power function can be ignored yielding:
thus a plot of fluorescence vs. concentration will be linear at low concentrations of the absorber and will become nonlinear when absorbance exceeds 0.05 (ca 90%T or \(c < 0.01\,\text{M}\) but dependent on molar absorptivity and fluorescence efficiency) and the remaining terms of the power series come into play. Note that the absorber concentration for fluorescence is lower than that of UV-visible spectroscopy. Fluorescence is nonlinear at a value of absorbance that is hardly on scale!
Quinine#
Quinine (Fig. 11, C20H24N2O2, 324.4 g/mol) will be used to demonstrate the quantitation and detection abilities of fluorescence as well as the pH dependence and quenching effects on fluorescence. Under usual conditions, quinine has two excitation peaks, a ground state to first excited state at 350 nm and a ground state to second excited state at 250 nm, and one emission peak at 450 nm. Care must be taken so that Rayleigh, Tyndall, and Raman scattering do not interfere. Rayleigh scattering refers to radiation scattered in all directions by elastic collisions (impinging and dispersed radiation are of the same wavelength and are radiated in a random manner). This is often seen as a band where monochromator wavelengths are the same and source radiation is deflected to the detector. Raman scattering involves inelastic collisions as electromagnetic energy is mixed with the rotational and vibrational energy of the colliding molecule resulting in radiation of a different wavelength.
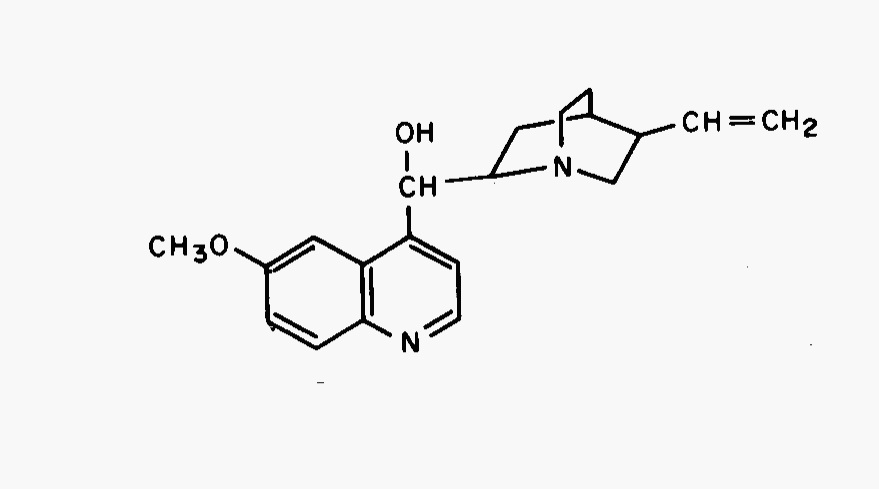
Fig. 11 Structure of quinine.#
Instrumentation#
In order to separate emitted radiation from incident radiation, fluorescent measurements are made at right angles to the incident beam. This is possible since incident radiation passes directly through the cell but fluorescence is emitted in all directions.
The typical fluorometer layout is shown in Fig. 12. Most of the components are the same as used for UV-visible spectroscopy. Exceptions include the source lamps which will be higher intensity for fluorescence since emission is dependent on source intensity. The limit to power of the source lamp will be the point where the molecules suffer thermal breakdown. The simplest instrument, a fluorometer, will have removable filters for wavelength discrimination. For scanning, a spectrofluorometer or fluorescence spectrophotometer, will have motored grating monochromators for wavelength control. Most scanning instruments are double beam in design with a reference photomultiplier to monitor source fluctuations. Although spectrofluorometers are more useful since they can obtain spectra, a fluorometer will have higher throughput and thus better sensitivity (also the source, sample, and detector are closer together enhancing sensitivity).
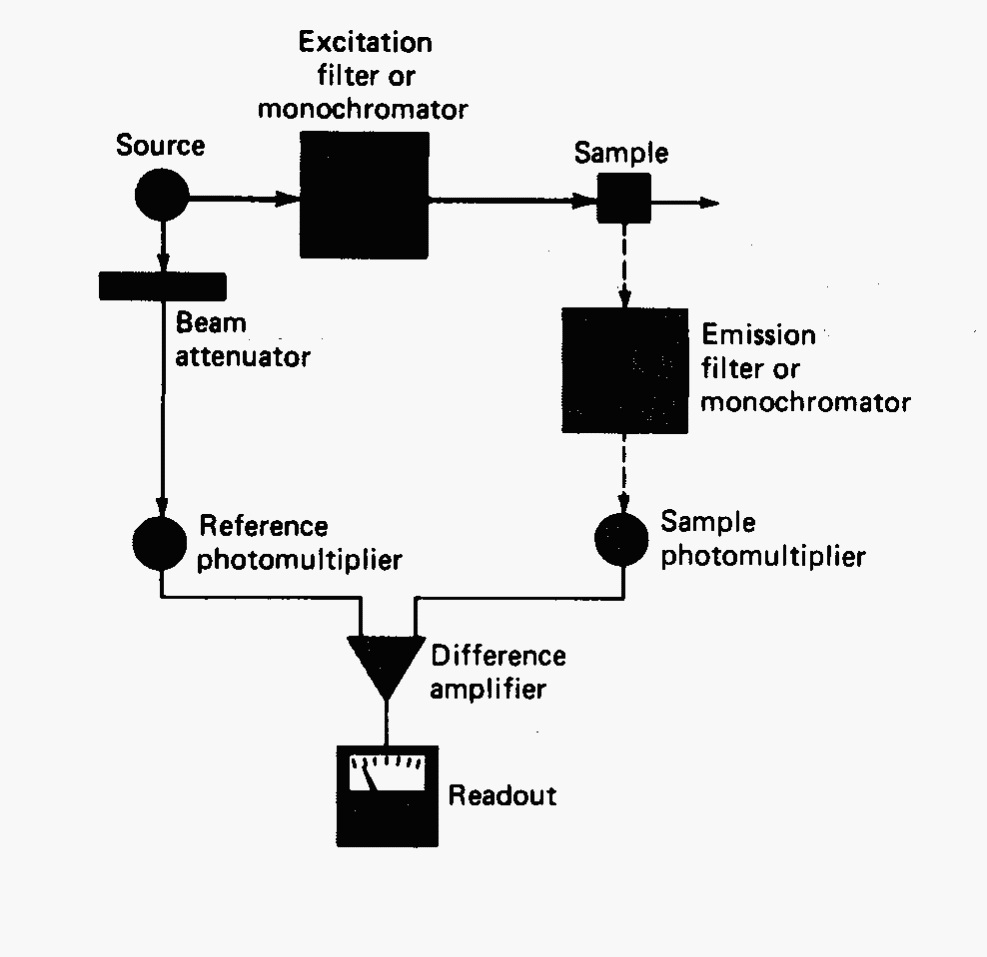
Fig. 12 Block diagram of a typical fluorometer or spectrofluorometer.#
Experimental#
- Apparatus
quartz cuvettes volumetric flasks (1 1000 mL, 6 100 mL, 12 25 mL)
pipets ( 6 10 mL, 12 2 mL)
- Chemicals
quinine stock solution (100.0 μg/mL)
Note
This must be prepared fresh every day and protected from light: obtain 120.7 mg quinine sulfate dihydrate or 100.0 mg quinine, transfer to a 1 L volumetric flask, add 50 mL of 1 M sulfuric acid and dilute to the mark with water
quinine stock solution (10.0 μg/mL) prepared from above
unknown quinine solution made in 0.05 M H2SO4 and stored in refrigerator
tonic water sample
0.05 M H2SO4 for dilutions
solid NaBr or a 0.05 M NaBr solution
buffers (higher capacity than pH buffers) pH 1, 2, 3, 4, 5, 6
Procedures#
Calibration Curve#
Prepare a series of quinine standards from the 100 μg/mL stock standard using 0.05 M sulfuric acid as the diluent. One source recommends a series of sequential tenfold dilutions until the most dilute sample gives a fluorescence intensity approximately equal to that of the blank (use the diluent as the blank). It is also a good idea to place standards between each sequential dilution so as to completely monitor curve shape. Ask previous project managers how they handled the curve!
Read the instructions for operation of the fluorometer. Record the excitation and emission spectra for quinine using a 2 μg/mL quinine solution. This, btw, is not a one step deal!
Next measure the fluorescence of each standard and the blank at the maximum excitation and emission frequencies for quinine using water to blank the instrument if needed/possible. Scanning is not helpful here! Also determine the fluorescence of the unknown quinine solution making proper dilutions in necessary to hit the linear region of the calibration curve.
Also measure the fluorescence of a sample of quinine tonic water after the following dilutions: pipet 5.00 mL of tonic water into a 250-mL volumetric flask, dilute to the mark with the sulfuric acid diluent (0.05 M H2SO4); pipet 5.00 mL of this solution into a 25-mL volumetric and again dilute to the mark with the sulfuric acid diluent [2]. Measure the fluorescence of this latter solution.
Treatment of Data#
Plot the relative intensity vs. Quinine concentration on log-log axes. If the sulfuric acid solution reading is not zero, its value should be subtracted form fluorescent readings before plotting. Discuss any deviation from nonlinearity in the plots and explain where the deviations arose. Determine the concentration of the unknown quinine sample and of the tonic water from the curve. Calculate the concentrations of quinine in undiluted unknown and tonic water.
Assume the limit of detection is the concentration of material that yields a fluorescence that is 10% more than the emission observed for the blank, and calculate its value for quinine. For example, if the water blank has a 20% reading, then the concentration of quinine that would give a reading of 22% would be the limit of detection. Also look at your data and see if you can extract limits of linearity for quinine using this fluorometer.
pH Dependence of Quinine Sulfate#
Pipet 2.0 mL of the 10.0 μg/mL standard quinine solution into a 25-mL volumetric flask and dilute to the mark with a pH 1 buffer solution. Measure the exact pH of the resulting solution with a pH meter. Repeat the procedure with the other five buffer solutions between pH 2 and 6. The concentration of quinine sulfate will be the same in all flasks. Measure the relative fluorescence intensity of all these solutions.
Treatment of Data#
Plot fluorescence intensity vs. pH for the six solutions. On the basis of these results, what conclusions can be drawn about the pH dependence of quinine sulfate? Suggest possible different structures for quinine involved. This is not occurring in a vacuum! We studied pKa’s last term. You are looking at other trends here!
Halide Quenching of Quinine Fluorescence#
Pipet 2.0 mL of the 10.0 μg/mL standard quinine solution into a 25-mL volumetric flask, add 1.0 mL of 0.05 M NaBr, and dilute to the mark with sulfuric acid diluent. Prepare four more solutions with 2.0 mL of the 10.0 μg/mL standard quinine solution in each and add 2.0-, 4.0-, 8.0-, and 16.0-mL portions of NaBr successively. Measure the relative fluorescence of these five solutions.
Treatment of Data#
Plot fluorescence intensity vs. bromide ion concentration and explain the results. Read your text! Could a very dilute HCl solution be used instead of 0.05 M H2SO4? Why?
Questions#
Explain why the radiation from fluorescence is measured 90° from the excitation radiation.
Discuss the deactivation processes which compete with fluorescence.
Describe methodology (process) of how fluorescence excitation spectra are measured. Why are these steps needed?
Which look similar to an absorption spectrum — a fluorescence excitation or fluorescence emission spectrum? How is the latter involved in the former? Why are there differences between these three spectra? Explain.