Synthesis and Analysis of Quantum Dots#
Perkin Elmer Lambda 1050 (UV-Vis)#
After sample preparation, your samples will be run using thin cuvettes (Brand Precision Cells Inc. Ocean Optics)
Check that the instrument is on and open the software PerkinElmer UV WinLab and select Analyst from the drop down menu
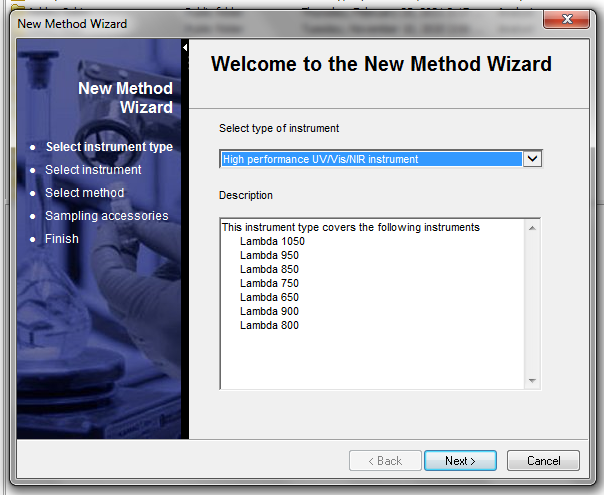
Select and from the instrument drop down select High performance UV/Vis/NIR instrument click next, then next again (this just confirms that the L1050/URA is selected
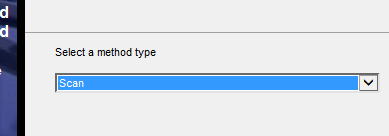
Select the Scan type then click next and select the Three Detectors Module
Finally, click Save/Finish and chose a folder to save the method to and give it a name
After creating a method, you will be prompted to the data collection screen, on the left is a panel of different setting that you can adjust
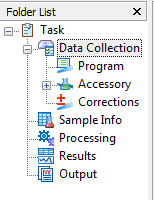
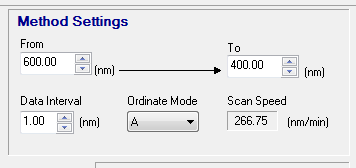
Under Data Collection you will need to adjust Method Settings
Attention
Make sure the D2 lamp and the Tungsten lamp are selected. (D2 is for the UV region and Tungsten is for the Visible region.)
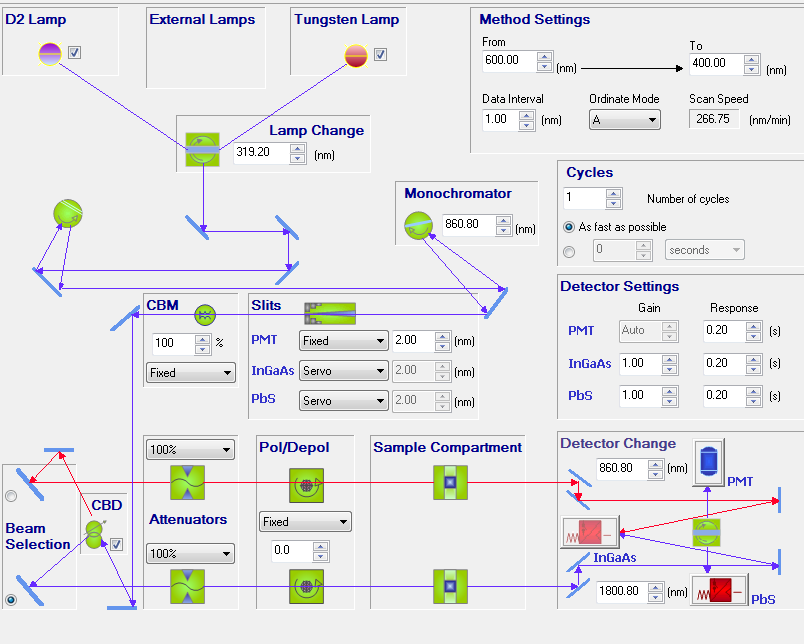
In the paper, Simple Syntheses of CdSe Quantum Dots in Figure 5, the UV/Vis wavelength range was from 400-600 nm, therefore you should enter these parameters in this section.
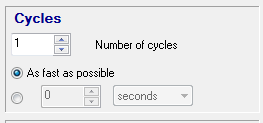
Under Cycles we entered 1 for the number of cycles and 2 seconds (We did not check As fast as possible because we initally had poor resolution and garbage data.
Under Sample Info the sample ID can be adjusted by double clicking (you can also add/delete rows as well)
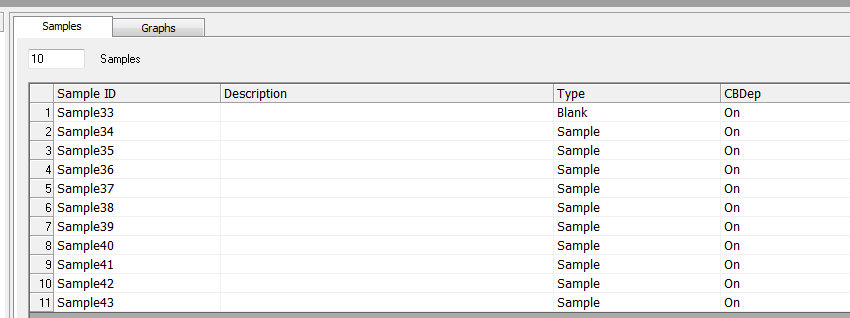
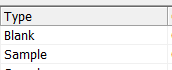
If you click on the Type you can change to either Blank, Control, or Sample depending on which you need (blank used here is 1-octadecene)
The rest of the tasks were not adjusted, from here you can place your blank in the sample holder and click Start… it will first go through some 100% Transmittance and other background scans, but it is fine if your blank remains in the cell during this process
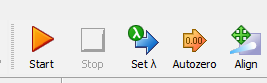
Eventually, the instrument will prompt you to place your blank in, just select “OK” and after the scan it will begin prompting you to enter your samples in the order in which you labeled them under Sample Info tab
At any point in time, you can click Cancel when the scan is finished, and return to the Sample Info tab where you can insert another row and perhaps redo a sample or even delete a sample if necessary
You will then be able to click Start again and resume where you left off - Finally, after all of your samples are run, you can click Send to DPV where another software opens up and you can export your data, do calculations, or analyze your results
If you export, you can do so as a csv file and use a flash drive which will open as an Excel file
PerkinElmer LS55 Fluorescence Spectrometer#
Following the instructions on the wiki page for the fluorimeter, you will need to create a
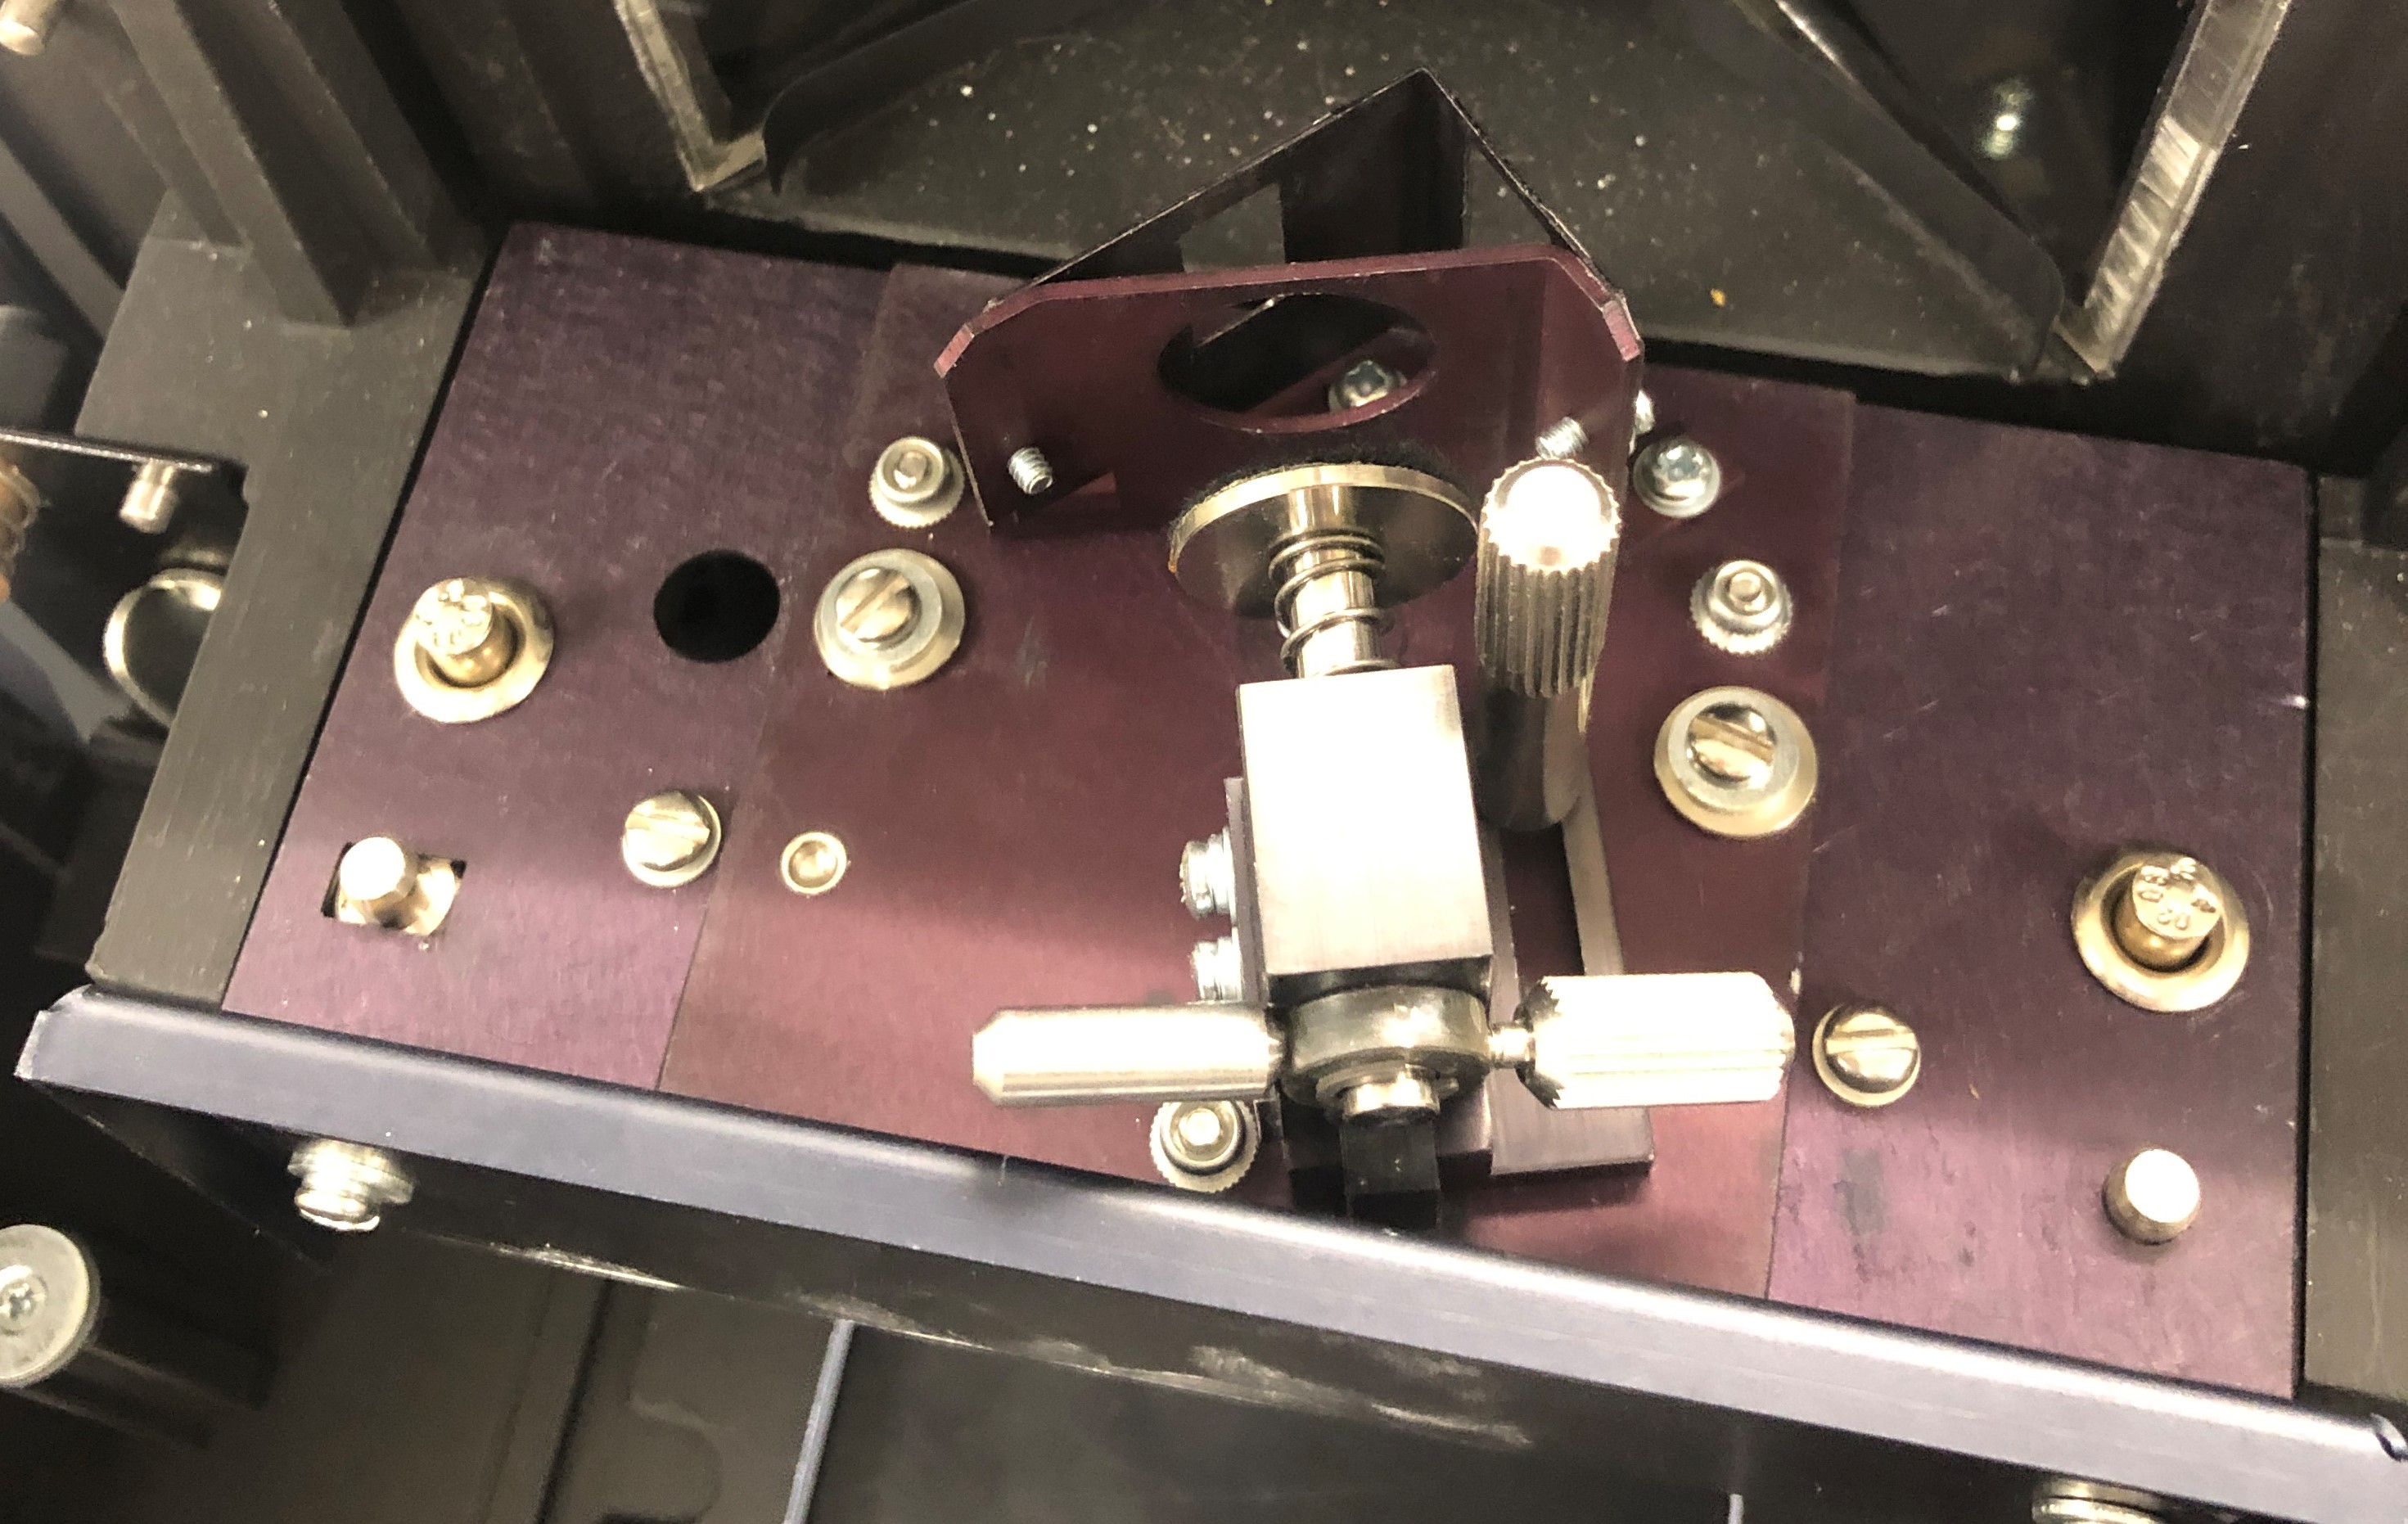
Under Samples you can add the same amount as in UV/Vis and the comparment was adjusted to include the sample holder shown below
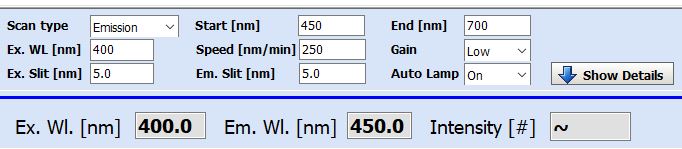
The parameters for the sample runs is listed below. You want to do an emission scan and set the excitation wavelength to 400 nm. The gain was set to low to allow less fuzzy emission spectra.
Once done, data can be saved and exported as a ascii.txt document to open in excel and perform data workup.