Cyclic Voltammetry of Fe(CN)63-/Fe(CN)64- Couple: Evaluation of CV as an Analytical Method#
Theory#
Cyclic voltammetry (CV) is perhaps the most versatile electroanalytical technique for the study of electroactive species. Its versatility combined with ease of measurement has resulted in extensive use of CV in the fields of electrochemistry, inorganic chemistry, organic chemistry, and biochemistry. CV is often the first experiment performed in an electrochemical study of an inorganic or organic compound, a biological material, or an electrode surface. The effectiveness of CV results from its capability for rapidly observing redox behavior over a wide potential range. The resulting voltammogram is analogous to a conventional spectrum in that it conveys information as a function of an energy scan.
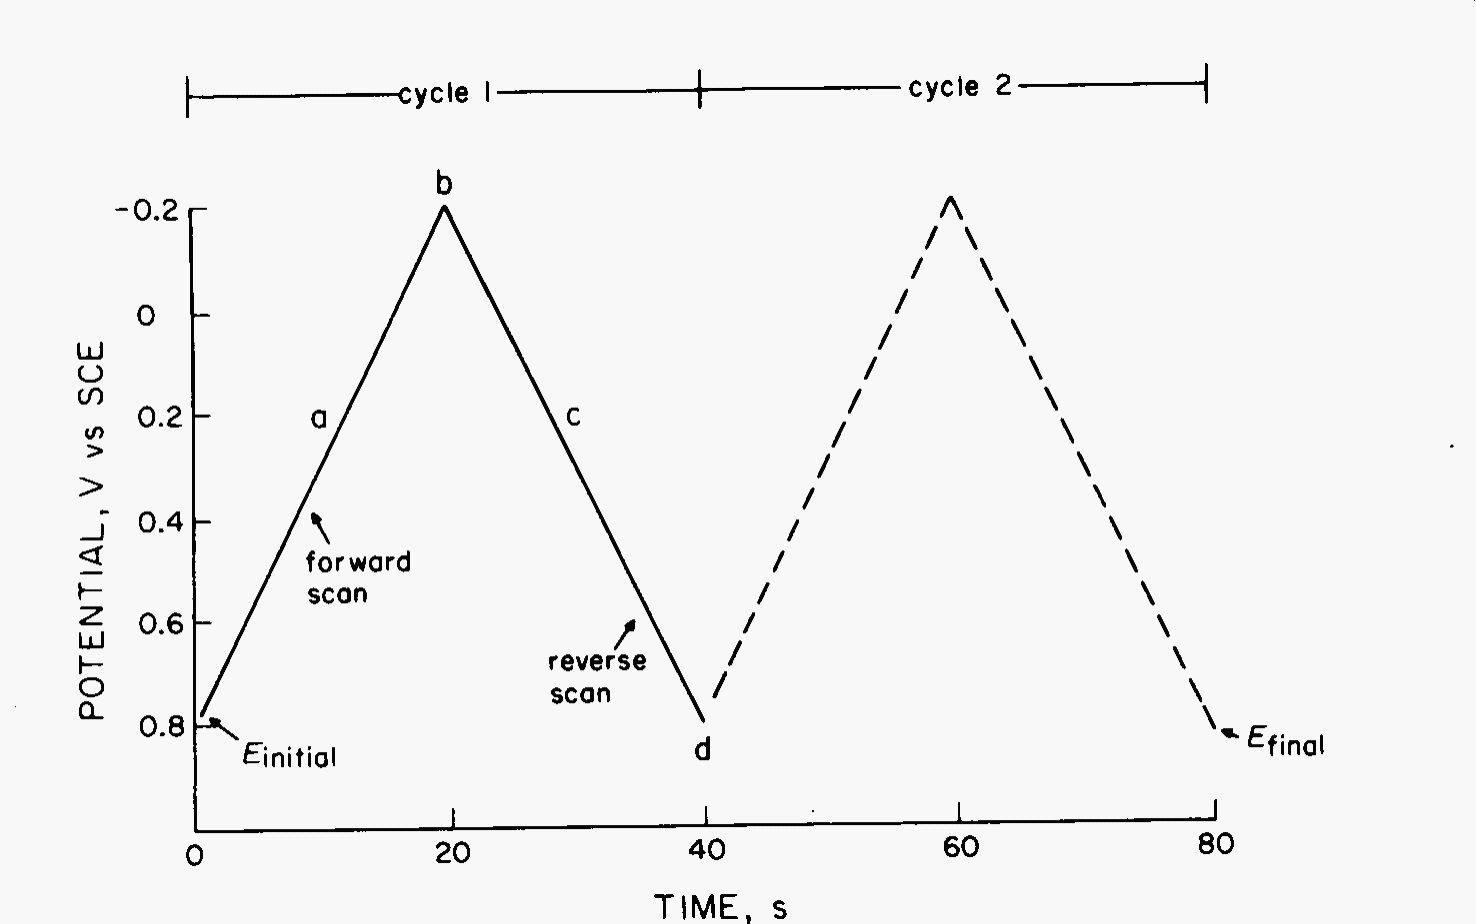
CV consists of cycling the potential of an electrode, which is immersed in an unstirred solution, and measuring the resulting current. The potential of this working electrode is controlled vs. a reference electrode such as an SCE or Ag/AgCl electrode. The controlling potential that is applied across these two electrodes can be considered an excitation signal. The excitation signal for CV is a linear potential scan with a triangular waveform as shown in Fig. 6. This triangular potential excitation signal sweeps the potential of the electrode between two values, sometimes called the switching potentials. The excitation signal in Fig. 6 causes the potential to first scan negatively from +0.80 to -0.20 V vs. SCE at which point the scan direction is reversed, causing a positive scan back to the original potential of +0.80 V. The scan rate, as reflected by the slope, is 50 mV/s. A second cycle is indicated by the dashed line. Single or multiple cycles can be used. Modern instrumentation enables switching potentials and scan rates to be easily varied.

Fig. 6 Excitation signal for a cyclic voltammetry experiment.#
A cyclic voltammogram is obtained by measuring the current at the working electrode during the potential scan. The current can be considered the response signal to the potential excitation signal. The voltammogram is a display of current (vertical axis) versus potential (horizontal axis). Because the potential varies linearly with time, the horizontal axis can also be thought of as a time axis. This is helpful in understanding the fundamentals of the technique.
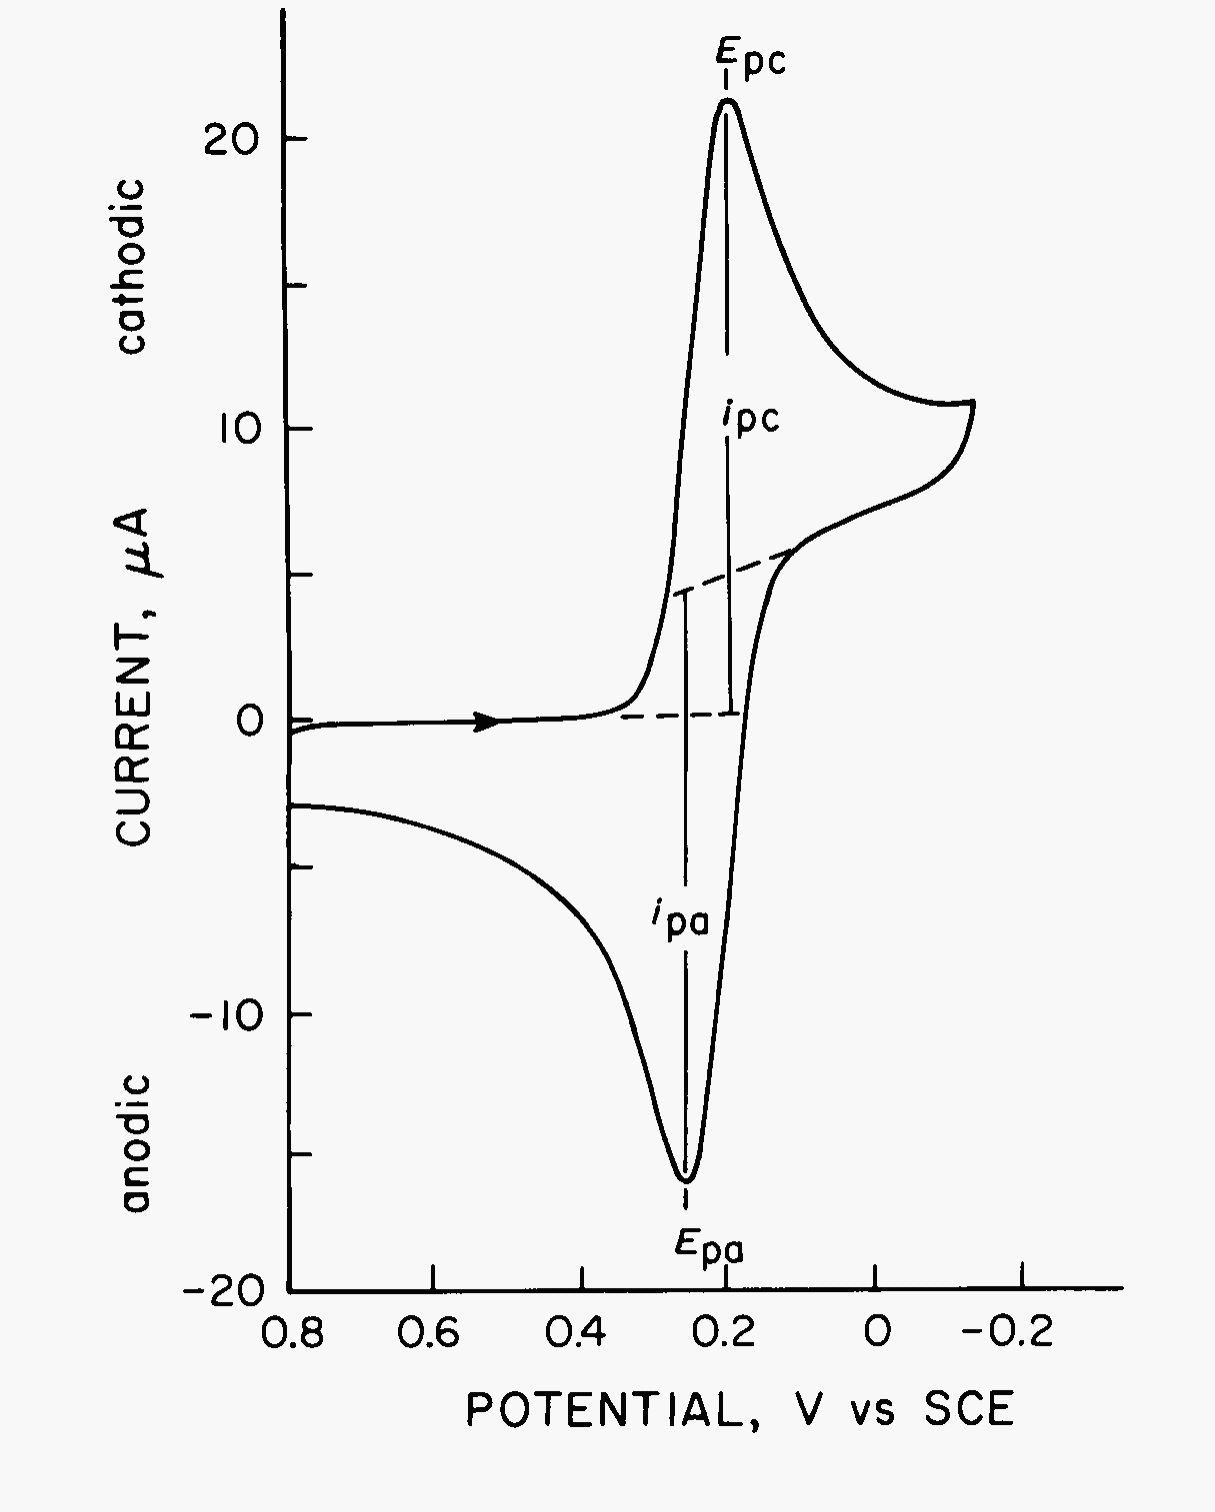
A typical cyclic voltammogram is shown in Fig. 7 for a platinum working electrode in a solution containing 6.0 mM K3Fe(CN)6 as the electroactive species in aqueous 1.0 M KNO3 as the supporting electrolyte. The potential excitation signal used to obtain this voltammogram is that shown in Fig. 6 but with a negative switching potential of -0.15 V. Thus, the vertical axis in Fig. 6 is now the horizontal axis for Fig. 7. The initial potential (\(E_i\)) of 0.80 V applied at the start is chosen to avoid any electrolysis of Fe(CN)63- when the electrode is switched on. The potential is then scanned negatively as indicated by the arrow. When the potential is sufficiently negative to reduce Fe(CN)63-, cathodic current is indicated at ca 0.35 V due to the electrode process:
The electrode is now a sufficiently strong reductant to reduce Fe(CN)63-. The cathodic current increases rapidly to a maximum when the concentration of Fe(CN)63- at the electrode surface approaches zero. The current then decays as the solution surrounding the electrode is depleted of Fe(CN)63- due to its electrolytic conversion to Fe(CN)64-. The scan direction is switched to positive at -0.15 V for the reverse scan. The potential is still sufficiently negative to reduce Fe(CN)63-, so cathodic current continues even though the potential is now scanning in the positive direction. When the electrode becomes a sufficiently strong oxidant, Fe(CN)64-, which has been accumulating adjacent to the electrode, can now be oxidized by the electrode process:
This causes anodic current. The anodic current rapidly increases until the surface concentration of Fe(CN)64- approaches zero and the current peaks. The current then decays as the solution surrounding the electrode is depleted of Fe(CN)64-. The first cycle is completed when the potential reaches +0.80 V. Now that the cyclic voltammogram is obtained, it is apparent that any potential positive of approximately +0.4 V would be suitable as an initial potential in that reduction of Fe(CN)63- would not occur when the potential is applied. This procedure avoids inadvertent electrolysis as a result of applying the initial potential.

Fig. 7 Cyclic voltammogram of 6 mM K3Fe(CN)6 in 1 M KNO3 from +0.80 V to -0.20 V vs SCE at 50 mV/s. Electrode was a 2.54 mm² platinum wire.#
Simply stated, in the forward scan Fe(CN)64- is electrochemically generated from Fe(CN)63- as indicated by the cathodic current. In the reverse scan this Fe(CN)64- is oxidized back to Fe(CN)63- as indicated by the anodic current. Thus, CV is capable of rapidly generating a new oxidation state during the forward scan and then probing its fate on the reverse scan. This very important aspect of the technique is useful in determining reaction mechanisms where intermediate species can be quickly probed.
A more detailed understanding of the cyclic voltammogram waveform can be gained by considering the Nernst equation and the changes in concentration that occur in solution adjacent to the electrode during electrolysis.
The important parameters of a cyclic voltammogram are the magnitudes of the anodic peak current (\(i_{\text{pa}}\)), cathodic peak current (\(i_{\text{pc}}\)), anodic peak potential (\(E_{\text{pa}}\)), and cathodic peak potential (\(E_{\text{pc}}\)). These parameters are labeled in Fig. 7. One method for measuring \(i_{\text{p}}\) involves extrapolation of a base-line current as shown in the figure. The establishment of a correct base line is essential for the accurate measurement of peak currents. This is not always easy, particularly for more complicated systems.
A redox couple in which both species rapidly exchange electrons with the working electrode is termed an electrochemically reversible couple. The formal reduction potential \(E°^\prime\) for a reversible couple is centered between \(E_{\text{pa}}\) and \(E_{\text{pc}}\):
The number (\(n\)) of electrons transferred in the electrode reaction for a reversible couple can be determined from the separation between the peak potentials:
Thus, a one-electron process such as the reduction of Fe(CN)63- to Fe(CN)64- exhibits a \(\Delta E_{\text{p}}\) of approximately 0.05916 V. Slow electron transfer at the electrode surface, “irreversibility,” causes this peak separation to increase.
The peak current for a reversible system is described by the Randles-Sevcik equation for the forward sweep of the first cycle
where \(i_{\text{p}}\) is the peak current (A), \(n\) is the electron stoichiometry, \(A\) is the electrode area (cm²), \(D\) is the diffusion coefficient, (cm²/s), \(C\) is the molar concentration, and \(\nu\) is the scan rate (V/s). Accordingly, \(i_{\text{p}}\), increases with \(\nu^{1/2}\) and is directly proportional to concentration. The relationship to concentration is particularly important in analytical applications and in studies of electrode mechanisms. The values of \(i_{\text{pa}}\) and \(i_{\text{pc}}\), should be close for a simple reversible (fast) couple. That is,
However, the ratio of peak currents can be significantly influenced by chemical reactions coupled to the electrode process.
Instrumentation#
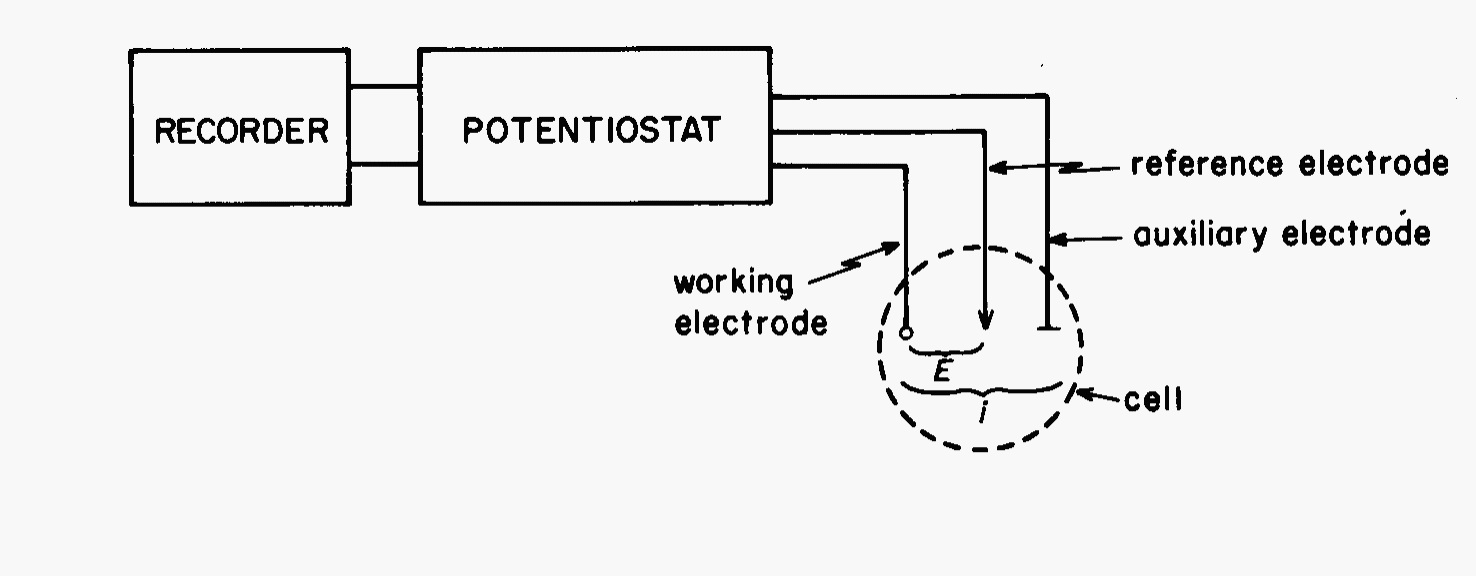
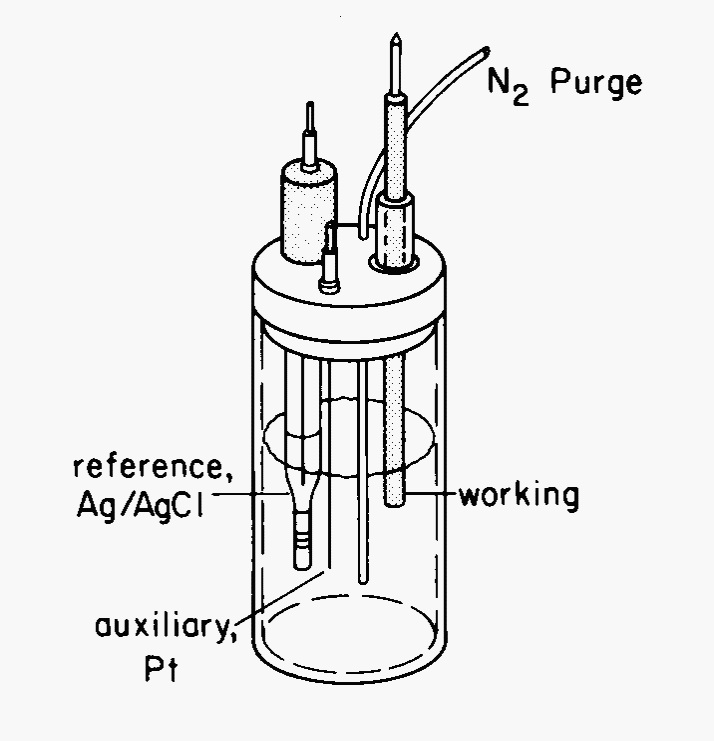
The instrumentation for a cyclic voltammetry experiment is quite simple which adds attraction to the technique. A potentiostat is required to set the potential of a working electrode with respect to a reference electrode. The potentiostat also has a current-to-voltage converter to measure the resulting current between the working electrode and an auxiliary electrode. This arrangement prevents to reference electrode from current flow which could cause a variation in its potential. A typical box diagram of the instrumentation is shown in Fig. 8 and a typical three electrode cell in Fig. 9.

Fig. 8 Instrumentation for cyclic voltammetry#

Fig. 9 Three electrode cell#
The electrochemical cell must be de-oxygenated using a flow of nitrogen or argon. Since cyclic voltammetry is a quiescent, or non-stirred method, to prevent reabsorption of oxygen, the purge gas flow is directed on top of the solution during the experiment. The reference electrode is either a saturated calomel electrode (SCE) or a saturated silver/silver chloride electrode. In either case, the end of the electrode is a Vycor sleeve that serves as a salt bridge. Working electrodes can be platinum, carbon, or gold. The auxiliary electrode is often a coil of platinum wire. If the work is exacting in nature, the cell should be thermostated as potentials depend on temperature.
Experimental#
- Apparatus
Electrochemical cell
Platinum working electrode
Platinum auxiliary electrode
SCE or Ag/AgCl reference electrode
Volumetric flasks, 25 mL and 100 mL
Fine alumina or diamond powder (paste)
- Chemicals
10 mM potassium ferricyanide (K3Fe(CN)6) in 1.0 M potassium nitrate (KNO3) stock solution
1.0 M KNO3
4 mM K3Fe(CN)6 in 1 M sodium sulfate (Na2SO4)
Unknown: K3Fe(CN)6 in 1.0 M KNO3
Procedure#
Pretreatment of the platinum working electrode surface may be required. Simply polishing the surface with powdered alumina and rinsing thoroughly with distilled water should suffice. The electrode can then be sonicated in an ultrasonic bath.
The cell is assembled and filled with 1 M KNO3 so that the ends of the electrodes are immersed. The cell is de-oxygenated by purging with N2 for approximately 10 minutes. Following this, N2 is directed over the solution to prevent oxygen from re-entering the cell during the remainder of the experiment.
While the cell is being de-oxygenated, the scan parameters can be set. The working electrode should be disconnected or switched off during this procedure. The initial potential is set at 0.80 V vs SCE, and the scan limits at 0.80 V (vs SCE) and -0.12 V (vs SCE) using the recorder as a monitor. All scans are initiated in the negative direction with a scan rate of 20 mV/s. These settings are to be used unless otherwise specified.
When de-oxygenation is complete, the working electrode is switched on. After allowing the current to attain a constant value (in about 10 s), the potential scan is initiated and a background CV of the supporting electrolyte solution is obtained.
After turning off the working electrode, the cell is cleaned and refilled with 4 mM Fe(CN)63- in 1 M KNO3. Following the same procedure as above, de-oxygenate the cell and obtain a CV of the Fe(CN)63-/Fe(CN)64- couple.
The effect of the scan rate (ν) on the voltammograms is observed by using this same solution and recording CV’s at the following rates: 20, 50, 75, 100, 125, 150, 175, and 200 m V/s (remember 100 mV/s is the same as 0.100 V/s so you can set them all!). Between each scan, initial conditions at the electrode surface are restored by moving the working electrode gently up and down without actually removing it from solution or by activating a stirring bar. Care should be taken that no bubbles remain on the electrodes. Allow a minute or two after stirring for the solution to come to rest before obtaining a CV.
Concentration likewise affects the magnitude of the peak current. This is seen by obtaining CV’s on 2, 4, 6, 8, and 10 mM Fe(CN)63- using a scan rate of 20 mV/s. A voltammogram of the unknown Fe(CN)6 solution should be obtained as well. Give your instructor some warning that the unknown will be needed and supply him with a clean 25-mL volumetric and the stock 10 mM Fe(CN)63- solution.
The effect of the supporting electrolyte on the appearance of the CV is demonstrated by recording two last voltammograms of 4 mM ferricyanide in 1 M KNO3 and in 1 M Na2SO4.
Treatment of Data#
Determine \(E°^\prime\) and \(n\) for the Fe(CN)63-/Fe(CN)64- couple in 1.0 M KNO3 from one of the cyclic voltammograms on Pt. Compare your value with one reported in the literature. (See I.M.Kolthoff and W.J. Tomsicek, J. Phys. Chem., 39, 945 (1935)).
Determine the effect of scan rate on peak height by calculating \(i_{\text{pa}}\), and \(i_{\text{pc}}\) for the various scan rates used in the scan rate experiment. Plot \(i_{\text{pc}}\) and \(i_{\text{pa}}\) vs. \(\nu^{1/2}\).
Determine the effect of scan rate on \(\Delta E_{\text{p}}\) by plotting \(\Delta E_{\text{p}}\) vs. ν. Explain what causes \(\Delta E_{\text{p}}\) to increase.
Determine the effect of concentration by plotting \(i_{\text{pa}}\) and \(i_{\text{pc}}\) vs. [Fe(CN)63-]. Also determine the [Fe(CN)63-] in your unknown.
Discuss the effect of supporting electrolyte on the shape of the voltammogram, \(E°^\prime\), and reversibility.
Questions#
Sketch the concentration-distance profiles (concentration of each species as you travel away from the electrode surface into the bulk solution) for Fe(CN)63- and Fe(CN)64- that would be expected at the following excitation voltages: 0.8 V, 0.4 V, 0.25 V, -0.2V on the excitation scan and 0.1 V, 0.25 V, and 0.8 V on the reverse scan on the CV in Fig. 7.
Using the profiles from Question 1 and (3), explain why the current increases rapidly, then peaks and decays during the forward scan in Fig. 7.
What would the reverse scan look like if a stirring bar were switched on at the switching voltage of -0.2 V during the CV in Fig. 7.
Explain why larger peak currents are obtained for faster scan rates. (Hint: What is the effect of a faster scan rate on the concentration distance profiles?)
Sketch the voltammogram that would be obtained if Fe(CN)64- reacted extremely rapidly to give another Fe(II)-containing species that is not electroactive within the potential range of 0.8 to -0.2 V vs. SCE.