Perkin-Elmer LS-55 Fluorimeter#
A fluorimeter measures the fluorescence or light emitted by different fluorescing objects. Fluorescence occurs when light of specific wavelength hits and excites electrons in a sample, and the electrons in that sample instantly emit or fluoresce light of a different wavelength. Ideally, emission and excitation spectra for the same analyte are mirror images of eachother with the excitation wavelenght being shorter than the emission wavelenght. In fluorescence spectroscopy, the light source and the detector are oriented at a 90 degree angle. Unlike UV-Vis spectroscopy, fluorescence spectroscopy is a measure of the ability of an analyte to emit light.
Procedure#
Make sure the instrument is turned on. Make your way through the trecherous journey behind the machines as the switch is in the back right corner. (You can also reach the switch from the front, on the left side when facing the instrument)
Turn on the monitor for the corresponding computer and log in with password Springchem2020 if needed.
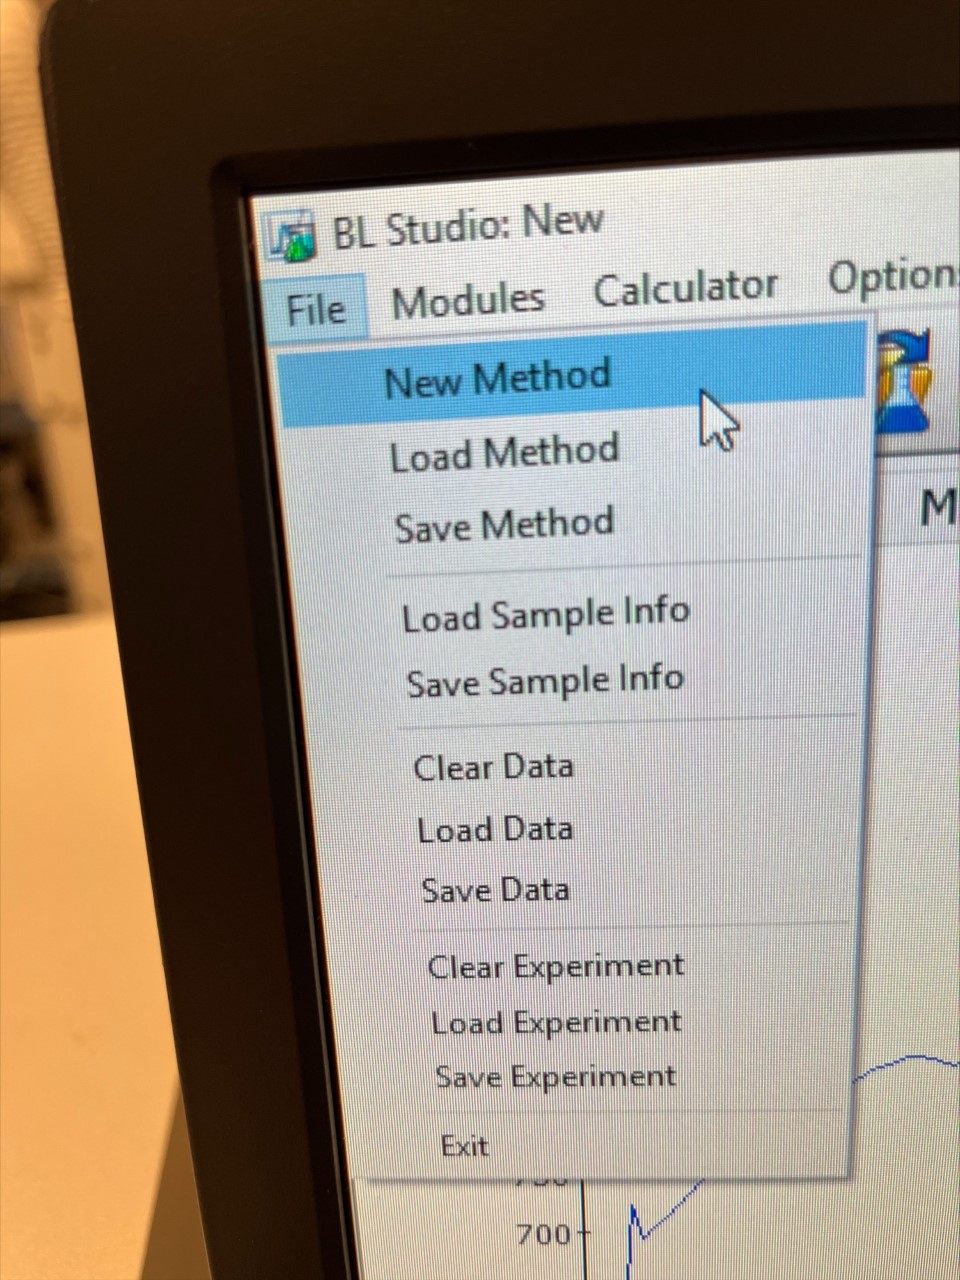
Open BLDevelopment

Click the New Method icon.
Use the FL Scan Aquisition Module. Everything else should be set to None.
Click the Manual Control Tab and make sure that Comport Com1 is checked. Everything else should be unchecked.
Open the sample compartment by pulling on the top of the light blue box. Notice that a nifty sample changer is installed! This allows for you to be able to load up to three samples at the same time (the fourth compartment is a little broken…). Remember to turn the knob after each scan! Don’t be a rookie!
Note
The fourth slot can be used if you use use the microspatula located on top of the PE LS 55 to pull back the clamp.
Tip
Cuvette lids can be used to boost the cuvette if there is not enough sample to analyze.
Back on the Acquisition tab, make sure that the Scan Type is Emission. The Ex. and Em. slit widths should be set to a wavelength that allows for the whole spectra to be seen. Decreasing the slit width adjusts how much light is hitting the sample — more light makes the peaks broader. Decrease the slits to ensure your limits aren’t exceeded for measurment! The scan speed is around 500 nm/min; if the spectra appears noisy, that means the speed is too fast. Ensure the Gain is set to Low; this is the numerical multiplier that attributes to the amplitude of the signal.
Note
These should be adjusted in order to find the clearest maximized excitation and emission peaks. Start with your most concentrated sample and adjust what is above to make sure its peak is seen on the computer.
Click the play button and then Start. Click Stop when the window pops up after your scan. The window asks if you would like to scan sample 2.
Find the maximum of the peak using the icon in the tool bar at the top of the page. Click the icon (a spectrum with a vertical line) and use the mouse to position the vertical line in the center of the peak of interest. This is your Emission Maximum. The Em WL will be displayed on the x axis.
Change the Scan Type to Excitation and the Em. WL to the value you determined in the last step. You may need to further decrease your slit widths (2.5 nm is the minimum). Identify the maximum here. This is your Excitation Maximum.
Finally, change the scan type back to Emission. This time, change your Ex. WL to the value you found in your previous step.
When you are choosing the range to scan for your molecule, keep in mind that the emission spectra will always be to the right of the excitation maximum, and the excitation spectra will always be to the left of the emission maximum.
Tip
After obtaining your emission spectrum, choose a wavelength range slightly below your emission peak maximum. This will reduce the possibility of obtaining peaks in error.
Finally, change the scan type back to Emission. This time, change your Ex. WL to the value you found in your previous step.
If making a standard curve, click on the New Method icon, but this time use the FL Read aquistion module. This will allow you to obtain the intensity.
Adjust the parameters for the Em WL and Ex WL to the maximum wavelength you determined in the previous scans. Use the same slit width for both Em and Ex as used before, too.
Now you may run your samples by clicking the play button and then Start. Make sure that if you have more than one sample in the carousel, you are spinning the knob each turn to correlate each sample! (In this mode, after you click Start to run each sample, the measurement will automatically appear after the scan and you are able to just click Start again to run the next sample)
If you have more than three samples to run, you should remember to keep the blank in the instrument carousel so you recalibrate it each time you open the cover.
When you are finished, save your data, close the program and turn off the machine.