Procedure#
Note
Instrument must be calibrated every 28 days.
Make sure the power is on to the spectrometer (well before the wet prep of your solution samples, duh!). The switch is around the back.
Open the PerkinElmer UV WinLab software and log in with Analyst.
Open the pre-made method “Scan”
Note
Scan is located in the left coloumn at the top of the first window seen when the program first opens.
Once “scan” is up and running, perform an auto-zero with absolutely nothing in the instrument.
On the left sie of the screen, there is a tab that reads “data collection”. This will allow you to see an electronic view of the whole instrument and change individual parameters.
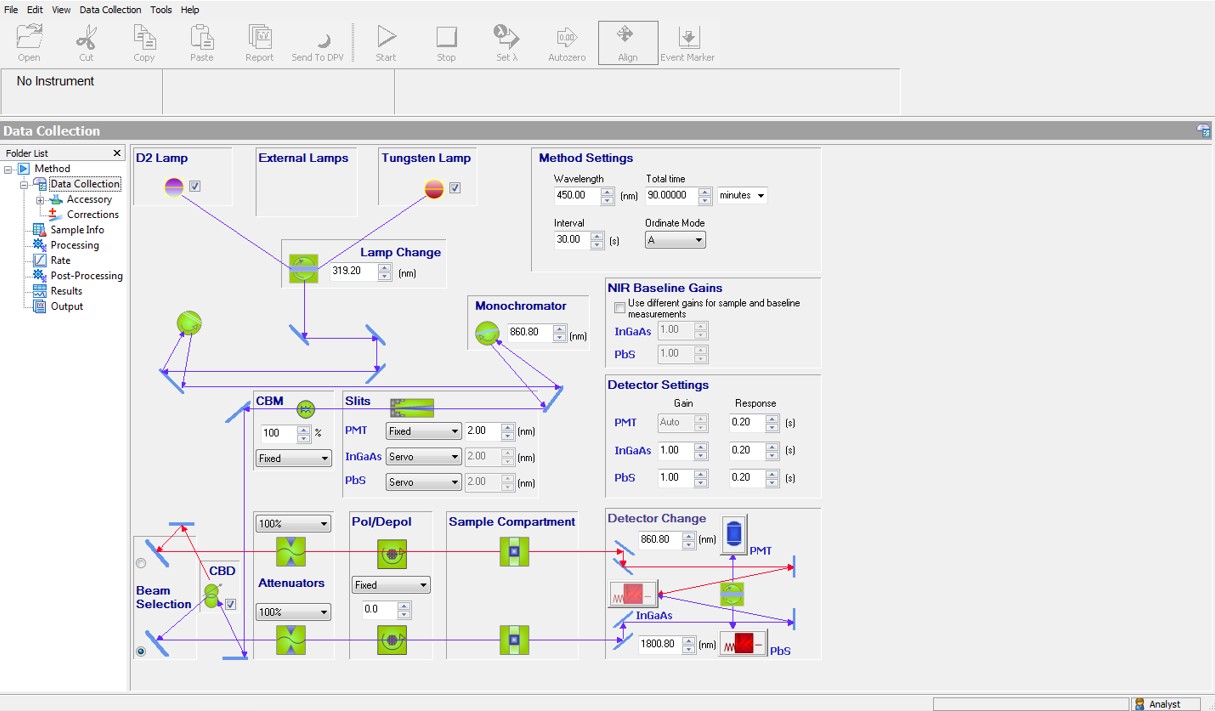
Set the following parameters:
scan from: 700 nm-300 nm (or other desired wavelength range)
Tip
The first scan should be broad to avoid missing absorbance peaks. Subsequent scans can be performed over smaller wavelength ranges once the absorbance peaks of the analyte are determined. This inital scan will be roughly 5 minutes.
Note
The wavelength range 700nm-300nm falls within the visible region, so turn off the D2 lamp for UV.
The other parameters can be kept at the default settings. However if you have a chiral species you can change lamp settings to (pol/depol) for polarized or depolarized.
Now you are ready to run the blank (the primary component(s) of the sample matrix: e.g. DI water) and the samples. Set up a sample method under the sample ID tab… should pop up when you first open the “scan” method. Add your desired amount of samples making sure you include the blank.
Place a two-sided frosted quartz cuvette in the front cell holder with your blank first, close the lid, and press the orange triangle to run.

Note
The cuvettes should be stored on the same lab bench as the instrument, look in the drawer under the computer for small, white boxes with a blue label (2 cuvvetes should be stored per box).
The instrument will instruct you what sample to place in the cell holder next, so just make sure you’re competant enough to follow the directions 🙂.
Once all of your samples have been run, open “Send to DPV” at the top of the screen. This allows you to see all of your samples over-layed on one another.
To export all of your data using an excel friendly format: press . Then save to your desired location on the desktop and drag it to your USB.
As a reference, it is encouraged to take a screenshot of the full spectrum with all the peaks. After taking this photo, save the image in your desired folder and transfer it to your flash drive.
If you are the last one to use the instrument, ensure the program is closed and the instrument is turned off.